Roark's Formulas for Excel Tutorial II
Five Quick Problems - Part 2 of 5Problem 2Let’s extend Problem 1 (Thursday, July 27) by adding beam support and load information. Specifically, assume that the beam will be steel, 6 ft long, fixed at both ends, with a maximum concentrated load of 2000 lbf at the center. You want to determine the deflection and stress values.
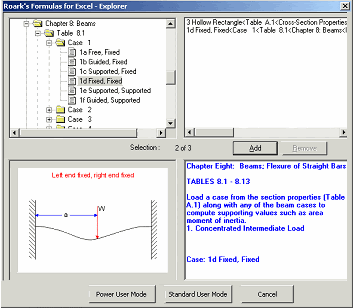
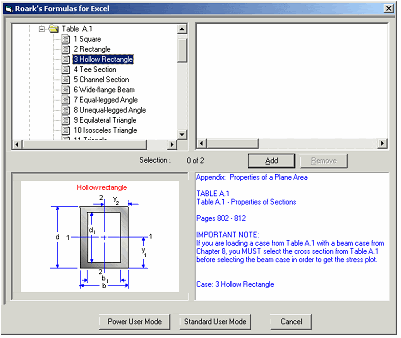
Open the Roark’s Formulas for Excel Explorer and select Table A.1, Case 3 (hollow rectangular cross-section). Then select Table 8.1, Case 1d and add this to the previous case selection.
Click the Standard User Mode button to continue.
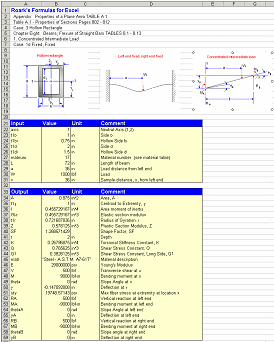
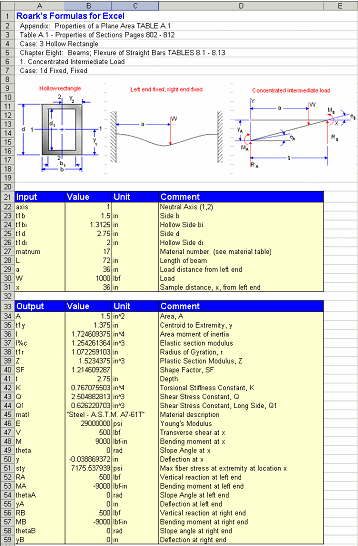
Once loaded into Excel the Worksheet looks as follows:
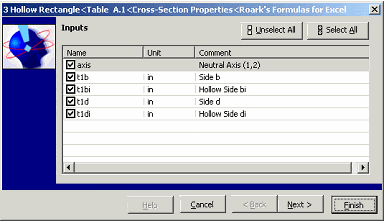
Now, enter the cross section dimensions in the Worksheet. Simply move to the Value column of the relevant variable and enter the data.
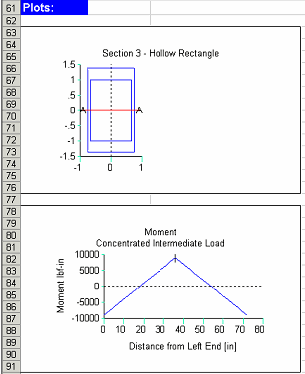
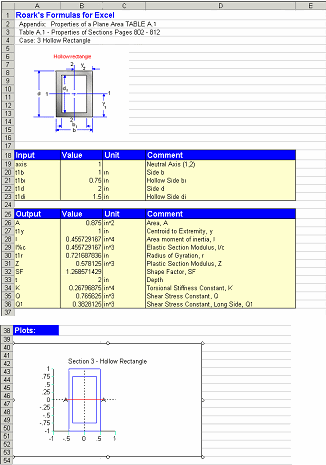
| Neutral Axis | 1 |
| Side b | 1.5 in |
| Hollow side bi | 1.3125 in |
| Side d | 2.75 in |
| Hollow side di | 2 in |
Note the revised Excel Worksheet.
Two Tech Calls That Make Me Wince
Question 1: Is there a way to access those NIST fluid properties dynamically within a TK rule? I click on the NIST Fluid Properties Wizard and some program called REFPROP pops up. Is there a way to tie the values from that program with TK.
Answer: Ouch... The REFPROP utility is included with TK to help you research fluid or mixture properties. It includes some nice plotting capabilities. But TK also includes built in fluid property functions that can be used in rules and functions. The on-line documentation summarizes these functions but the easiest way to access them is via the Wizards tab at the bottom of the Navigation bar. Click on Function Wizards and you will see Fluid Properties at the bottom.
Question 2: I have multiple sets of x,y data I want to plot on the same graph. How do I do that?
Answer: Well... You need to copy all the x values in series to a single list and then line up the element numbers of the corresponding y value lists so they are the same as the x values. If you need to maintain the original list elements, then you will need to copy (using the LISTCOPY function) the lists to new lists and then reposition those elements. Meanwhile, the pre-release TK6 I'm using has multiple x-axis lists on the plot subsheet, so this question is about to completely go away. I can't wait!
Manuals, Forums, Tutorials, Tech Notes and Blogs
I'm told you're more likely to read a Blog than other forms of communication. In our case, the UTS web site includes Testimonials, Case Studies, Forums and Tech Notes -- lots to browse. I encourage you to browse the Forums and Tech Notes sections of the UTS site, as there are many answers to questions there. I'm hoping that the Tech Notes section will soon have a search feature based on keywords so that you don't have to browse through 139+ documents to find your answer. TK's on-line documentation and help file are well-organized and I hope you use those often.
So why add a Blog? How can we make this time well spent for you? I intend to use this as an avenue to share solutions to interesting (to me anyway) tech calls and problems encountered during the many projects we tackle here. I suppose I could use the Forums for this but I guess I'd rather leave that as an area where users can ask questions and interact.
I think this will be a good way to share thoughts on new features too.
Roark’s Formulas for Excel Tutorial
Five Quick Problems - Part 1 of 5Tutorials will use the Standard User Mode to highlight the simplicity in using this software. All Tutorials are shown with the US unit system.
Problem 1 Suppose you are designing a beam with a hollow rectangular section and you need to know the area, moment of inertia, and plastic section modulus.
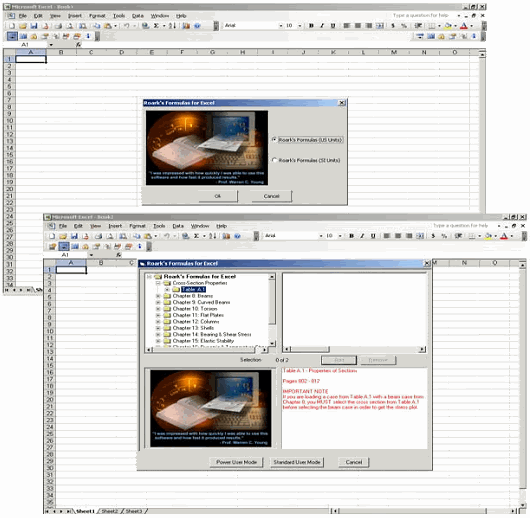
Start Excel and click on Roark’s Formulas for Excel (RFE) Explorer on the Roark’s Formulas for Excel Toolbar. Select the US unit system and click OK to open the Roark’s Formulas for Excel Explorer.
When the Explorer appears, select Table A.1, Case 3 by either double-clicking it or by clicking on it then clicking the Add button. Your selection is confirmed when it is displayed in the upper right portion of the Explorer screen.
After making your selection, click the Standard User Mode button to continue.
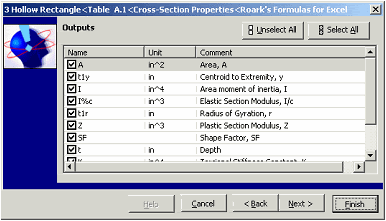
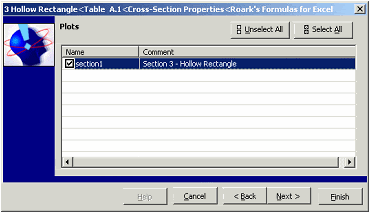
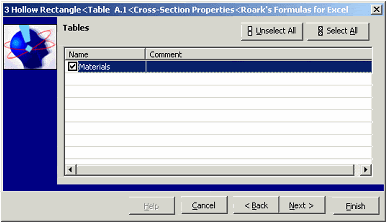
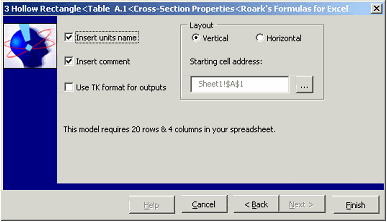
Click the Finish button to link the model into the Excel Worksheet.
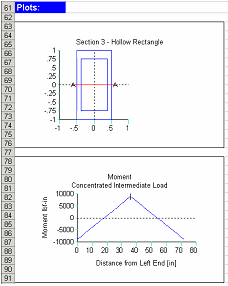
You can now explore further on the Excel sheet. Change the inputs, change the units and see the results and plots instantly update.
Coming Soon - IGS Service Pack 3
We're getting ready to release the latest upgrade to Integrated Gear Software. Our gear engineer, Jim, filled me in on some of the new features. Now IGS will have Range Analysis, an Exported File Set Viewer, Gear Mesh Animation, a DXF converter, and Ticona M15HP. There are a few other changes (minor features, bug fixes, etc.); these will be officially announced with the release.
- Range Analysis:
Range Analysis allows you to select a variable from the model to assign a range of values. You may select up to seven dependent variables to tabulate. Simply assign values to the independent variable and solve for the range. Values for each dependent variable will be computed for each value of the independent variable. All values are then presented in a table that may be conveniently printed in a professional looking report.
- Exported File Set Viewer:
When importing a data file from one of several archived .igs files, it can be difficult to find the archive you need. Previously, one had to load each archive in order to view its contents. Now, the Exported File Set Viewer allows you to see the contents of the archive before loading it, similar to viewing the contents of a .zip file.
- Gear Mesh Animation:
Now you can animate the mesh while viewing the gear mesh plot in 60-400, 60-450 or 60-610. The animator will rotate the gears through the length of the active profile, allowing you to observe contact conditions and root clearances.
- DXF Converter:
Licensed users of 60-410, 60-460 and 60-470 will now be able to easily export tooth coordinates for shaped, hobbed and formed teeth. This converter will generate a DXF and ASCII file of “X” and “Y” coordinates to many more significant decimal places than the old converter. Simply enter in the list names and click convert. The “X” and “Y” list names can be obtained from the plot sub sheet. When the converted file is loaded into CAD, a polyline of the tooth profile is constructed with its center at coordinates 0,0.
- Material Added to 60-610
Ticona M15HP has been added to the program. M15HP Celcon (POM) is a higher performance acetal copolymer.
To learn more about our Integrated Gear Software, visit the
IGS page on our website.
Welcome to the Universal Technical Systems Blog
Thanks for visiting our new blog! We are an engineering software company located in Rockford, IL. You may recognize us as the creators of TK Solver, Integrated Gear Software, and Interactive Roark's Formulas. You can visit our website at www.UTS.com. Some of the things we hope to do with this blog are:
- Offer tips and tricks on our existing software products and services.
- Introduce our latest releases.
- Address customer concerns and questions.
- Share industry news and information about upcoming events.
- Keep our customers up to date about what's been going on at UTS headquarters.
You'll be hearing from various team members, including:
- Kim, Communications Specialist: Industry News, Product News, Events, etc.
- Todd, our TK Solver expert: tips and tricks for TK Solver users.
We hope you will come back and visit us often!